Maps, Tables, and Figures
Assignment #5
 |
| Figure 3: Soil Moisture in the Easter part of Africa along the Nile River |
 |
| Figure 4: Ethiopian Soil Moisture Values |
 |
| Figure 5: Nile Delta Soil Moisture Values |
 |
| Figure 6: Precipitation Levels Across Northern Africa July 2012 |
 |
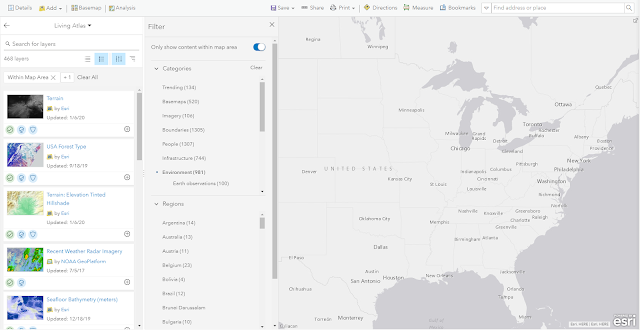
| Figure 7: Setting up out ArcGIS Online Map |
 |
| Figure 8a: Las Vegas 2004-2005 |
 |
| Figure 8b: Las Vegas 2005-2006 |
 |
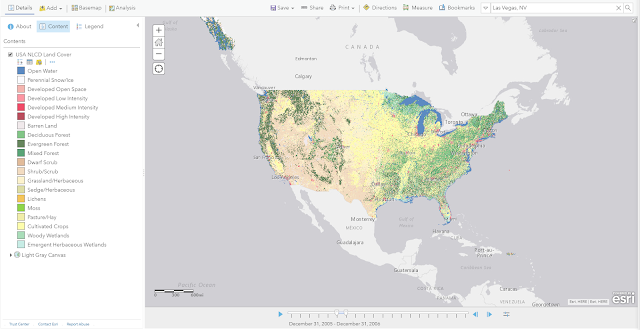
| Figure 9: The Entire 48 Consecutive States of the United States and Legend |
 |
| Figure 10: Washington D.C., Baltimore, Philadelphia Areas Dc. 2005-2006 |
 |
| Figure 11: Washington D.C., Baltimore, Philadelphia Areas with County Overlay Dec. 2005-2006 |
 |
| Figure 13: Hurricane Irma Path |
 |
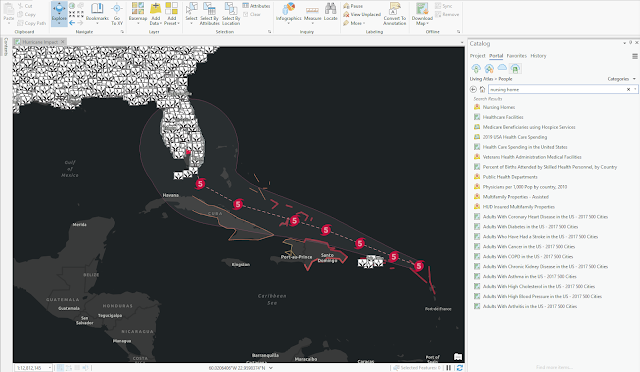
| Figure 15: Active Irma Route and Affected Nursing Home |
 |
| Figure 16: Hurricane Evacuation Routes |
 |
| Figure 17: National Shelter System - Open Shelters |
 |
| Figure 18: Local Emergency Operations Center (EOC) |
 |
| Figure 19: Public Schools |
 |
| Figure 20: Major Cities |
 |
| Figure 21: Clutter Map |
Assignment #4
 |
| Figure 1: Orthomosaic & DSM without GCP correction |
 |
| Figure 4: Pix4D Point cloud |
 |
| Figure 5: DSM Elevation Comparison |
 |
| Figure 6: Processing times |
Assignment #3
 |
| Figure 1: Completed Assignment Poster |
 |
| Figure 3: Slope Map |
 |
| Figure 4: Aspect Map |
 |
| Figure 5: Hillshaded Map |
 |
| Figure 6: Orthomosaic |
 | ||
Figure 1: Core of your Information from ArcGIS Pro, Get Started with ArcGIS
|


Comments
Post a Comment